
 Deutsch
 English
 Русский
Benchmark Email Email Deliverability Report

In this email deliverability report for Benchmark Email, there are, among other things, depth details on the deliverability of emails in comparison with other providers and how good the delivery rates in the numerous industries and with different email providers are.
There is a compact review of Benchmark Email. It outlines the most important features of Benchmark Email, answers some questions and also publishes user reviews.
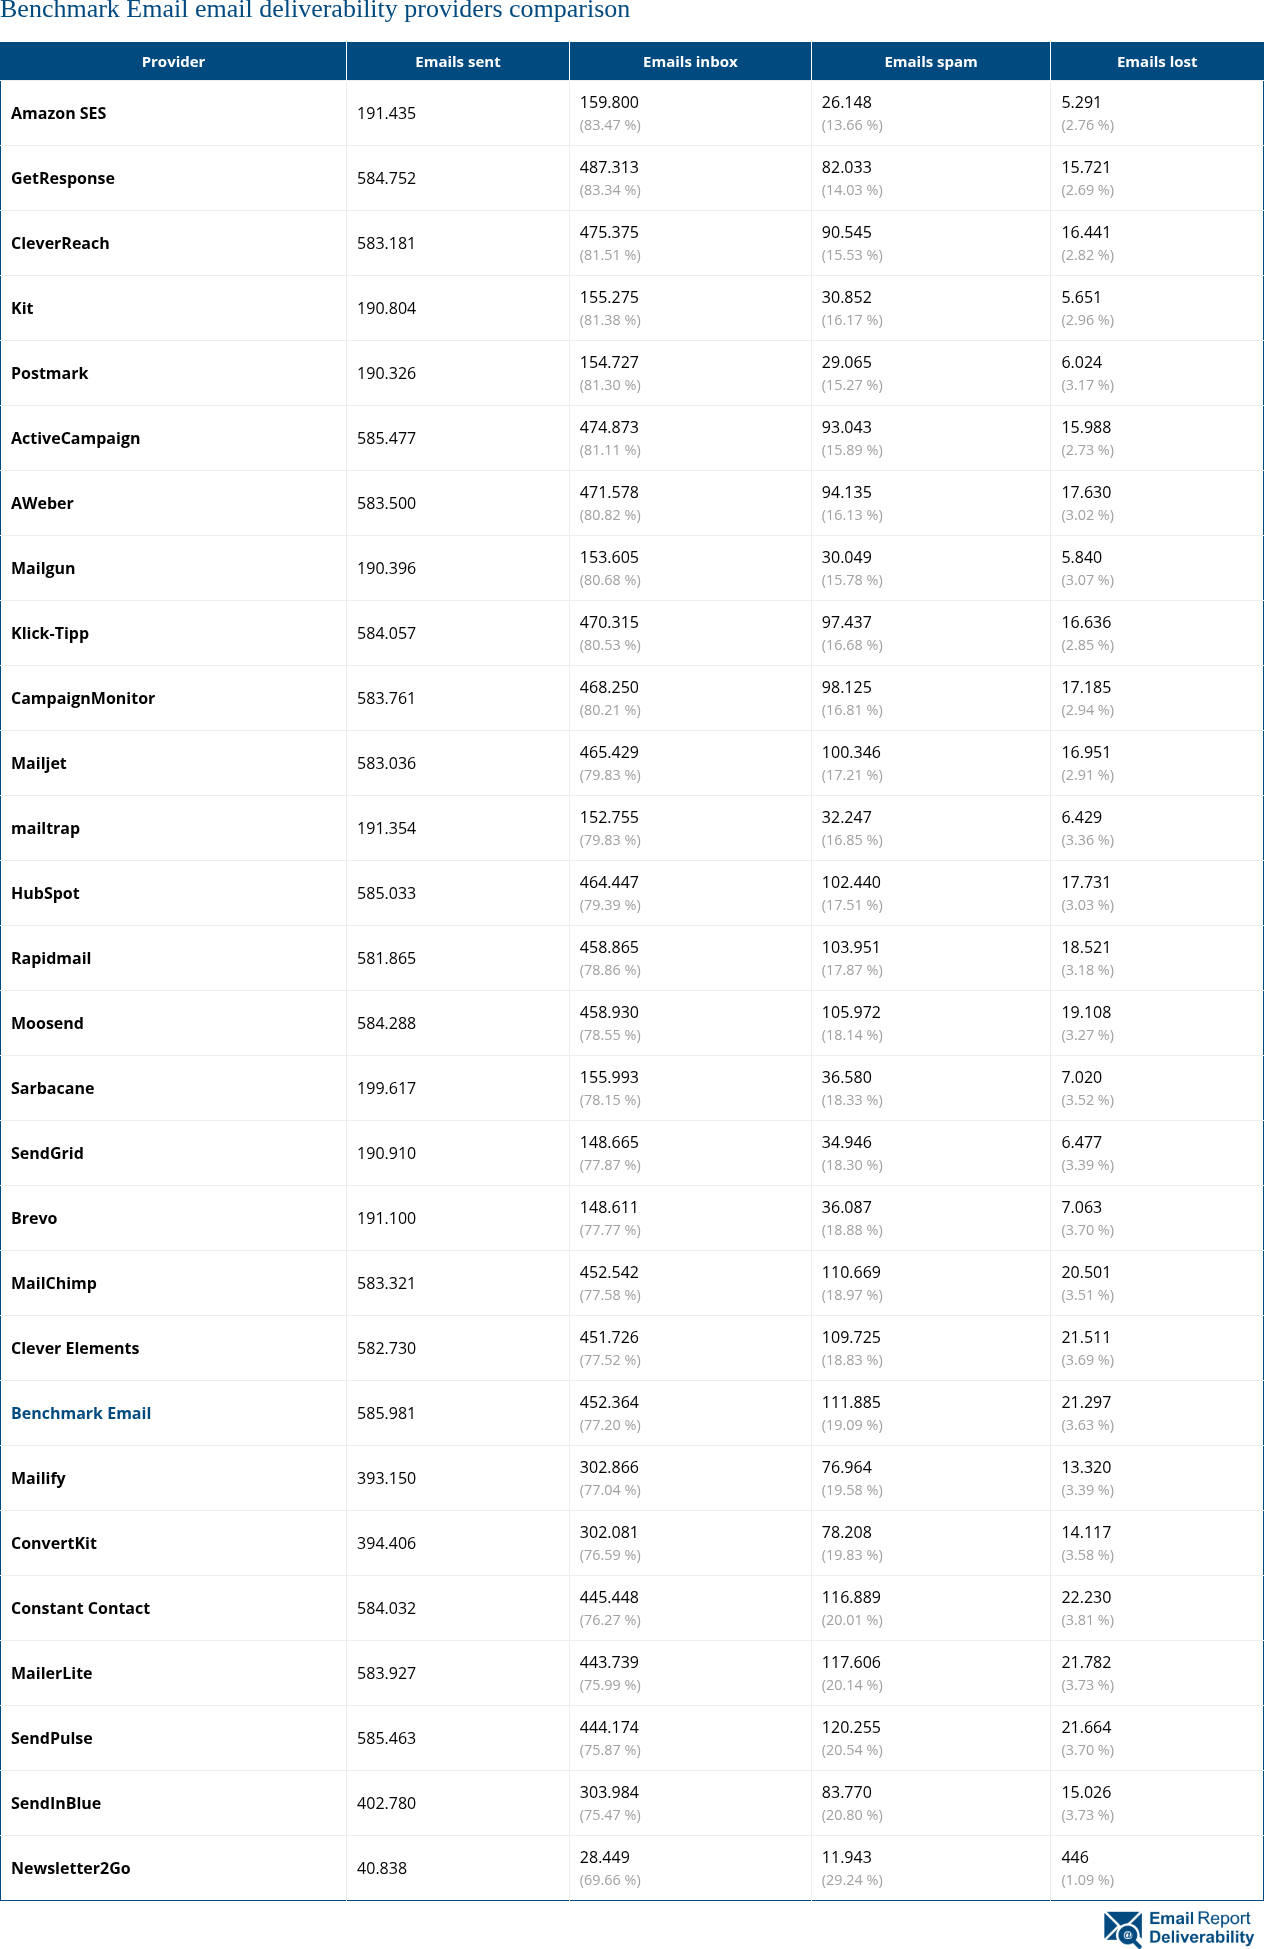
Email deliverability for Benchmark Email and other providers comparison
A total of 66.061 emails were sent with Benchmark Email. A total of 50.618 emails were delivered to the recipient's main mailbox. Of all emails sent, 13.815 emails ended up in the spam folder. 1.628 emails were lost on the way to the recipients.
| Provider | Emails sent | Emails inbox | Emails spam | Emails lost |
|---|---|---|---|---|
| Brevo | 65.578 | 51.753 (78.92 %) | 12.631 (19.26 %) | 1.194 (1.82 %) |
| Klick-Tipp | 66.326 | 51.987 (78.38 %) | 13.088 (19.73 %) | 1.251 (1.89 %) |
| Sarbacane | 66.014 | 51.676 (78.28 %) | 13.064 (19.79 %) | 1.274 (1.93 %) |
| CampaignMonitor | 65.293 | 50.958 (78.05 %) | 13.015 (19.93 %) | 1.320 (2.02 %) |
| Postmark | 65.170 | 50.776 (77.91 %) | 13.059 (20.04 %) | 1.335 (2.05 %) |
| Rapidmail | 64.973 | 50.580 (77.85 %) | 13.066 (20.11 %) | 1.327 (2.04 %) |
| SendPulse | 65.521 | 50.907 (77.70 %) | 13.179 (20.11 %) | 1.435 (2.19 %) |
| GetResponse | 65.810 | 51.088 (77.63 %) | 13.306 (20.22 %) | 1.416 (2.15 %) |
| ActiveCampaign | 65.585 | 50.859 (77.55 %) | 13.328 (20.32 %) | 1.398 (2.13 %) |
| CleverReach | 65.729 | 50.913 (77.46 %) | 13.357 (20.32 %) | 1.459 (2.22 %) |
| MailChimp | 66.082 | 51.160 (77.42 %) | 13.535 (20.48 %) | 1.387 (2.10 %) |
| HubSpot | 65.472 | 50.685 (77.41 %) | 13.324 (20.35 %) | 1.463 (2.23 %) |
| SendGrid | 64.932 | 50.153 (77.24 %) | 13.282 (20.46 %) | 1.497 (2.31 %) |
| AWeber | 64.880 | 50.089 (77.20 %) | 13.406 (20.66 %) | 1.385 (2.13 %) |
| mailtrap | 64.339 | 49.599 (77.09 %) | 13.283 (20.65 %) | 1.457 (2.26 %) |
| MailerLite | 65.677 | 50.404 (76.75 %) | 13.751 (20.94 %) | 1.522 (2.32 %) |
| Kit | 65.621 | 50.314 (76.67 %) | 13.738 (20.94 %) | 1.569 (2.39 %) |
| Benchmark Email | 66.061 | 50.618 (76.62 %) | 13.815 (20.91 %) | 1.628 (2.46 %) |
| Mailgun | 65.051 | 49.710 (76.42 %) | 13.808 (21.23 %) | 1.533 (2.36 %) |
| Moosend | 65.406 | 49.964 (76.39 %) | 13.921 (21.28 %) | 1.521 (2.33 %) |
| Constant Contact | 66.103 | 50.487 (76.38 %) | 13.951 (21.10 %) | 1.665 (2.52 %) |
| Mailjet | 65.532 | 49.814 (76.01 %) | 14.051 (21.44 %) | 1.667 (2.54 %) |
| Amazon SES | 66.036 | 49.737 (75.32 %) | 14.491 (21.94 %) | 1.808 (2.74 %) |
| Clever Elements | 64.996 | 48.939 (75.30 %) | 14.255 (21.93 %) | 1.802 (2.77 %) |
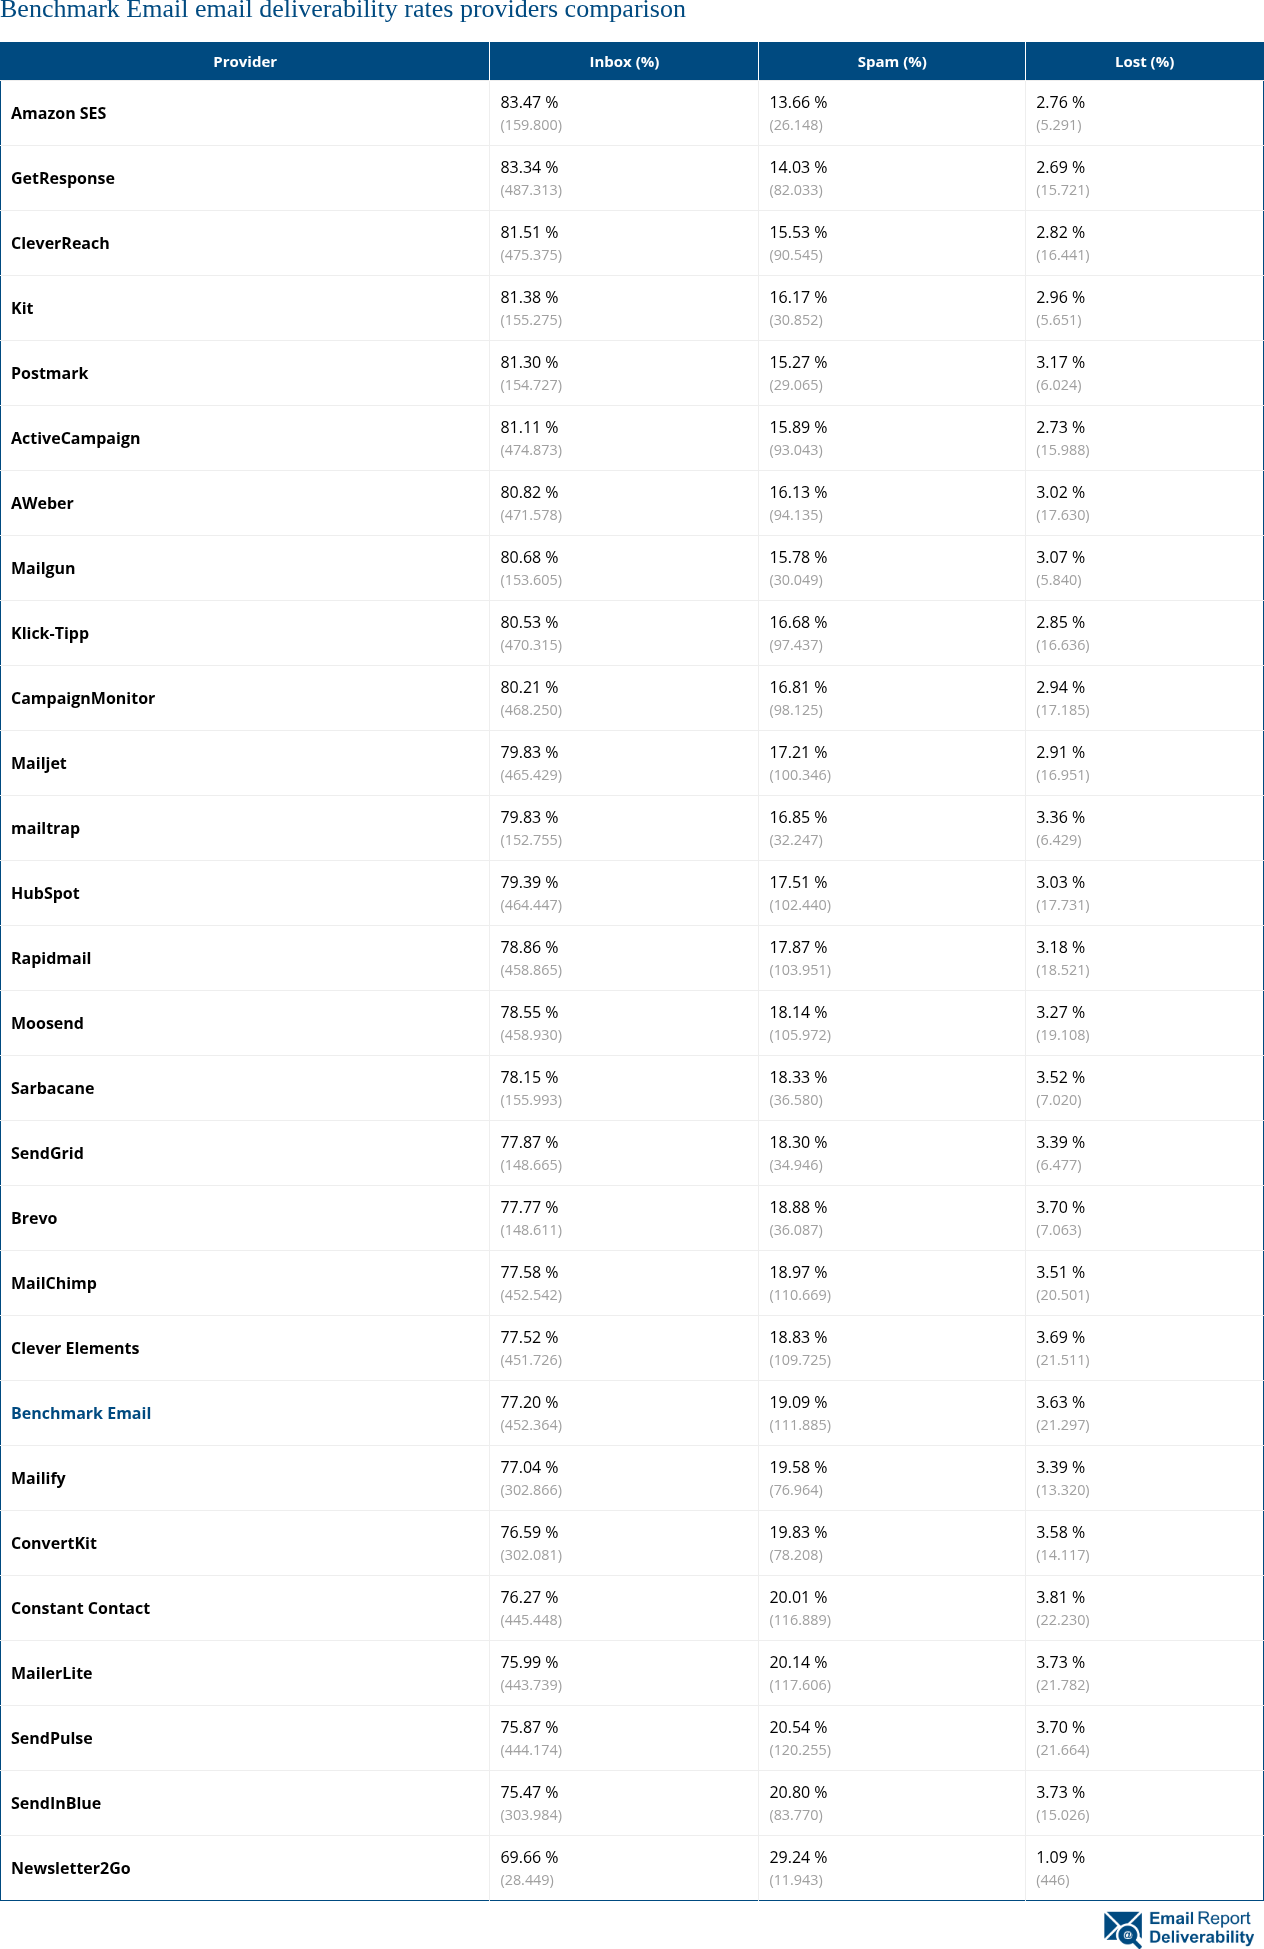
Email deliverability rates for Benchmark Email and other providers comparison
76.62 % of 66.061 emails sent with Benchmark Email ended up in the recipient's main mailbox. 20.91 % of all emails were moved from the email providers to the spam folder after successful delivery. 2.46 % of all emails sent did not reach the recipients.
| Provider | Inbox (%) | Spam (%) | Lost (%) |
|---|---|---|---|
| Brevo | 78.92 % (51.753) | 19.26 % (12.631) | 1.82 % (1.194) |
| Klick-Tipp | 78.38 % (51.987) | 19.73 % (13.088) | 1.89 % (1.251) |
| Sarbacane | 78.28 % (51.676) | 19.79 % (13.064) | 1.93 % (1.274) |
| CampaignMonitor | 78.05 % (50.958) | 19.93 % (13.015) | 2.02 % (1.320) |
| Postmark | 77.91 % (50.776) | 20.04 % (13.059) | 2.05 % (1.335) |
| Rapidmail | 77.85 % (50.580) | 20.11 % (13.066) | 2.04 % (1.327) |
| SendPulse | 77.70 % (50.907) | 20.11 % (13.179) | 2.19 % (1.435) |
| GetResponse | 77.63 % (51.088) | 20.22 % (13.306) | 2.15 % (1.416) |
| ActiveCampaign | 77.55 % (50.859) | 20.32 % (13.328) | 2.13 % (1.398) |
| CleverReach | 77.46 % (50.913) | 20.32 % (13.357) | 2.22 % (1.459) |
| MailChimp | 77.42 % (51.160) | 20.48 % (13.535) | 2.10 % (1.387) |
| HubSpot | 77.41 % (50.685) | 20.35 % (13.324) | 2.23 % (1.463) |
| SendGrid | 77.24 % (50.153) | 20.46 % (13.282) | 2.31 % (1.497) |
| AWeber | 77.20 % (50.089) | 20.66 % (13.406) | 2.13 % (1.385) |
| mailtrap | 77.09 % (49.599) | 20.65 % (13.283) | 2.26 % (1.457) |
| MailerLite | 76.75 % (50.404) | 20.94 % (13.751) | 2.32 % (1.522) |
| Kit | 76.67 % (50.314) | 20.94 % (13.738) | 2.39 % (1.569) |
| Benchmark Email | 76.62 % (50.618) | 20.91 % (13.815) | 2.46 % (1.628) |
| Mailgun | 76.42 % (49.710) | 21.23 % (13.808) | 2.36 % (1.533) |
| Moosend | 76.39 % (49.964) | 21.28 % (13.921) | 2.33 % (1.521) |
| Constant Contact | 76.38 % (50.487) | 21.10 % (13.951) | 2.52 % (1.665) |
| Mailjet | 76.01 % (49.814) | 21.44 % (14.051) | 2.54 % (1.667) |
| Amazon SES | 75.32 % (49.737) | 21.94 % (14.491) | 2.74 % (1.808) |
| Clever Elements | 75.30 % (48.939) | 21.93 % (14.255) | 2.77 % (1.802) |
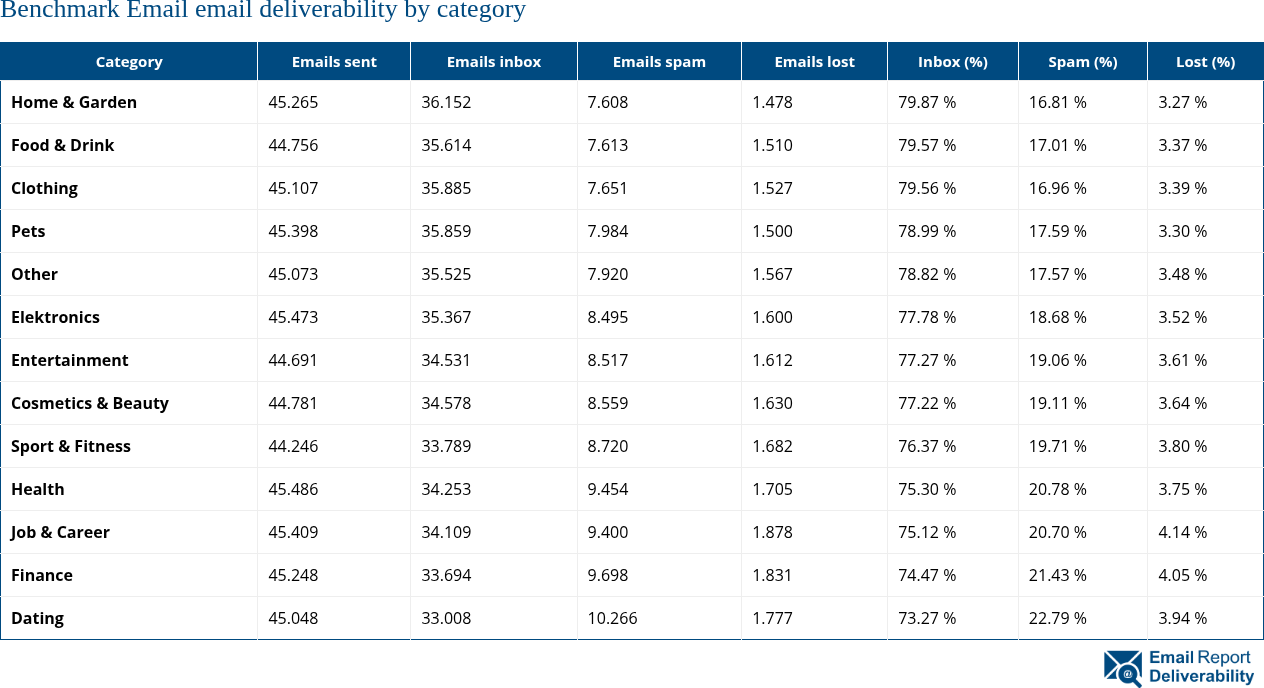
Email deliverability by category
The delivery of the emails with Benchmark Email in the categories Health, Finance, Other, Elektronics and Entertainment resulted in the best delivery rates. In contrast, the worst delivery rates were achieved for categories Dating, Job & Career, Clothing, Sport & Fitness and Home & Garden.
| Category | Emails sent | Emails inbox | Emails spam | Emails lost | Inbox (%) | Spam (%) | Lost (%) |
|---|---|---|---|---|---|---|---|
| Health | 5.057 | 4.077 | 859 | 121 | 80.62 % | 16.99 % | 2.39 % |
| Finance | 5.164 | 4.115 | 929 | 120 | 79.69 % | 17.99 % | 2.32 % |
| Other | 5.136 | 4.030 | 981 | 125 | 78.47 % | 19.10 % | 2.43 % |
| Elektronics | 4.947 | 3.824 | 1.000 | 123 | 77.30 % | 20.21 % | 2.49 % |
| Entertainment | 5.021 | 3.848 | 1.042 | 131 | 76.64 % | 20.75 % | 2.61 % |
| Pets | 5.210 | 3.989 | 1.084 | 137 | 76.56 % | 20.81 % | 2.63 % |
| Cosmetics & Beauty | 5.117 | 3.912 | 1.074 | 131 | 76.45 % | 20.99 % | 2.56 % |
| Food & Drink | 4.942 | 3.770 | 1.048 | 124 | 76.28 % | 21.21 % | 2.51 % |
| Home & Garden | 4.962 | 3.769 | 1.072 | 121 | 75.96 % | 21.60 % | 2.44 % |
| Sport & Fitness | 5.096 | 3.867 | 1.108 | 121 | 75.88 % | 21.74 % | 2.37 % |
| Clothing | 5.096 | 3.839 | 1.131 | 126 | 75.33 % | 22.19 % | 2.47 % |
| Job & Career | 5.089 | 3.769 | 1.199 | 121 | 74.06 % | 23.56 % | 2.38 % |
| Dating | 5.224 | 3.809 | 1.288 | 127 | 72.91 % | 24.66 % | 2.43 % |
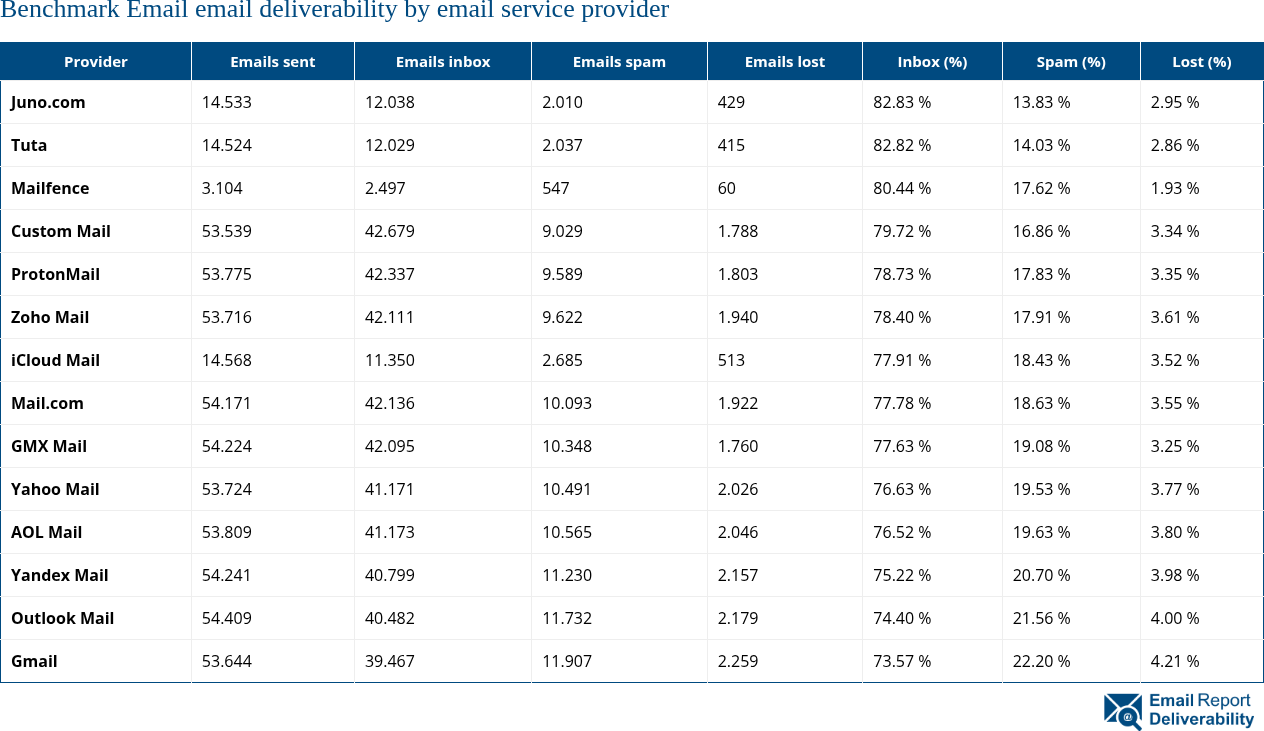
Email deliverability by email service provider
According to the test results, the three best email providers for highest delivery rates with Benchmark Email are Custom Mail, Tuta and Juno.com. The delivery rates were worst for the email providers iCloud Mail, Gmail and GMX Mail.
| Provider | Emails sent | Emails inbox | Emails spam | Emails lost | Inbox (%) | Spam (%) | Lost (%) |
|---|---|---|---|---|---|---|---|
| Custom Mail | 4.773 | 3.802 | 853 | 118 | 79.66 % | 17.87 % | 2.47 % |
| Tuta | 4.794 | 3.787 | 891 | 116 | 78.99 % | 18.59 % | 2.42 % |
| Juno.com | 4.753 | 3.744 | 896 | 113 | 78.77 % | 18.85 % | 2.38 % |
| Mailfence | 4.730 | 3.716 | 902 | 112 | 78.56 % | 19.07 % | 2.37 % |
| ProtonMail | 4.776 | 3.743 | 914 | 119 | 78.37 % | 19.14 % | 2.49 % |
| Zoho Mail | 4.629 | 3.604 | 912 | 113 | 77.86 % | 19.70 % | 2.44 % |
| Mail.com | 4.740 | 3.650 | 975 | 115 | 77.00 % | 20.57 % | 2.43 % |
| AOL Mail | 4.583 | 3.482 | 981 | 120 | 75.98 % | 21.41 % | 2.62 % |
| Yahoo Mail | 4.535 | 3.437 | 981 | 117 | 75.79 % | 21.63 % | 2.58 % |
| Yandex Mail | 4.759 | 3.597 | 1.053 | 109 | 75.58 % | 22.13 % | 2.29 % |
| Outlook Mail | 4.678 | 3.530 | 1.025 | 123 | 75.46 % | 21.91 % | 2.63 % |
| GMX Mail | 4.721 | 3.532 | 1.078 | 111 | 74.81 % | 22.83 % | 2.35 % |
| Gmail | 4.929 | 3.617 | 1.192 | 120 | 73.38 % | 24.18 % | 2.43 % |
| iCloud Mail | 4.661 | 3.377 | 1.162 | 122 | 72.45 % | 24.93 % | 2.62 % |
Benchmark Email badges for website
The following badges for Benchmark Email can be embedded into a website.

References and Resources
Further resources and references for Benchmark Email.