 Deutsch
 English
 Русский
SendInBlue Email Deliverability Report

Email deliverability for SendInBlue and other providers comparison
| Provider | Emails sent | Emails inbox | Emails spam | Emails lost |
|---|---|---|---|---|
| GetResponse | 64.855 | 52.595 (81.10 %) | 11.200 (17.27 %) | 1.219 (1.88 %) |
| AWeber | 64.722 | 51.689 (79.86 %) | 11.957 (18.47 %) | 1.254 (1.94 %) |
| CleverReach | 64.607 | 51.485 (79.69 %) | 11.987 (18.55 %) | 1.282 (1.98 %) |
| HubSpot | 64.920 | 51.721 (79.67 %) | 12.211 (18.81 %) | 1.231 (1.90 %) |
| Benchmark Email | 65.210 | 51.727 (79.32 %) | 12.292 (18.85 %) | 1.362 (2.09 %) |
| Brevo | 65.359 | 51.606 (78.96 %) | 12.735 (19.48 %) | 1.306 (2.00 %) |
| mailtrap | 64.364 | 50.801 (78.93 %) | 12.496 (19.41 %) | 1.364 (2.12 %) |
| Klick-Tipp | 65.017 | 51.104 (78.60 %) | 12.712 (19.55 %) | 1.428 (2.20 %) |
| Postmark | 63.961 | 50.217 (78.51 %) | 12.619 (19.73 %) | 1.413 (2.21 %) |
| MailChimp | 65.267 | 51.137 (78.35 %) | 13.071 (20.03 %) | 1.361 (2.09 %) |
| MailerLite | 65.001 | 50.857 (78.24 %) | 12.922 (19.88 %) | 1.453 (2.24 %) |
| CampaignMonitor | 64.477 | 50.429 (78.21 %) | 12.942 (20.07 %) | 1.320 (2.05 %) |
| Sarbacane | 64.877 | 50.734 (78.20 %) | 13.143 (20.26 %) | 1.267 (1.95 %) |
| Amazon SES | 65.251 | 50.995 (78.15 %) | 12.880 (19.74 %) | 1.512 (2.32 %) |
| Mailjet | 64.204 | 50.113 (78.05 %) | 12.867 (20.04 %) | 1.421 (2.21 %) |
| SendPulse | 64.719 | 50.459 (77.97 %) | 13.109 (20.26 %) | 1.463 (2.26 %) |
| Kit | 64.911 | 50.481 (77.77 %) | 13.230 (20.38 %) | 1.420 (2.19 %) |
| Constant Contact | 64.550 | 49.829 (77.19 %) | 13.300 (20.60 %) | 1.734 (2.69 %) |
| Rapidmail | 64.021 | 49.316 (77.03 %) | 13.356 (20.86 %) | 1.567 (2.45 %) |
| Clever Elements | 63.847 | 49.164 (77.00 %) | 13.326 (20.87 %) | 1.624 (2.54 %) |
| Mailgun | 64.615 | 49.541 (76.67 %) | 13.785 (21.33 %) | 1.579 (2.44 %) |
| ActiveCampaign | 64.940 | 49.739 (76.59 %) | 13.801 (21.25 %) | 1.663 (2.56 %) |
| Moosend | 64.906 | 49.689 (76.56 %) | 13.800 (21.26 %) | 1.670 (2.57 %) |
| SendGrid | 64.547 | 49.094 (76.06 %) | 14.120 (21.88 %) | 1.594 (2.47 %) |
Preview
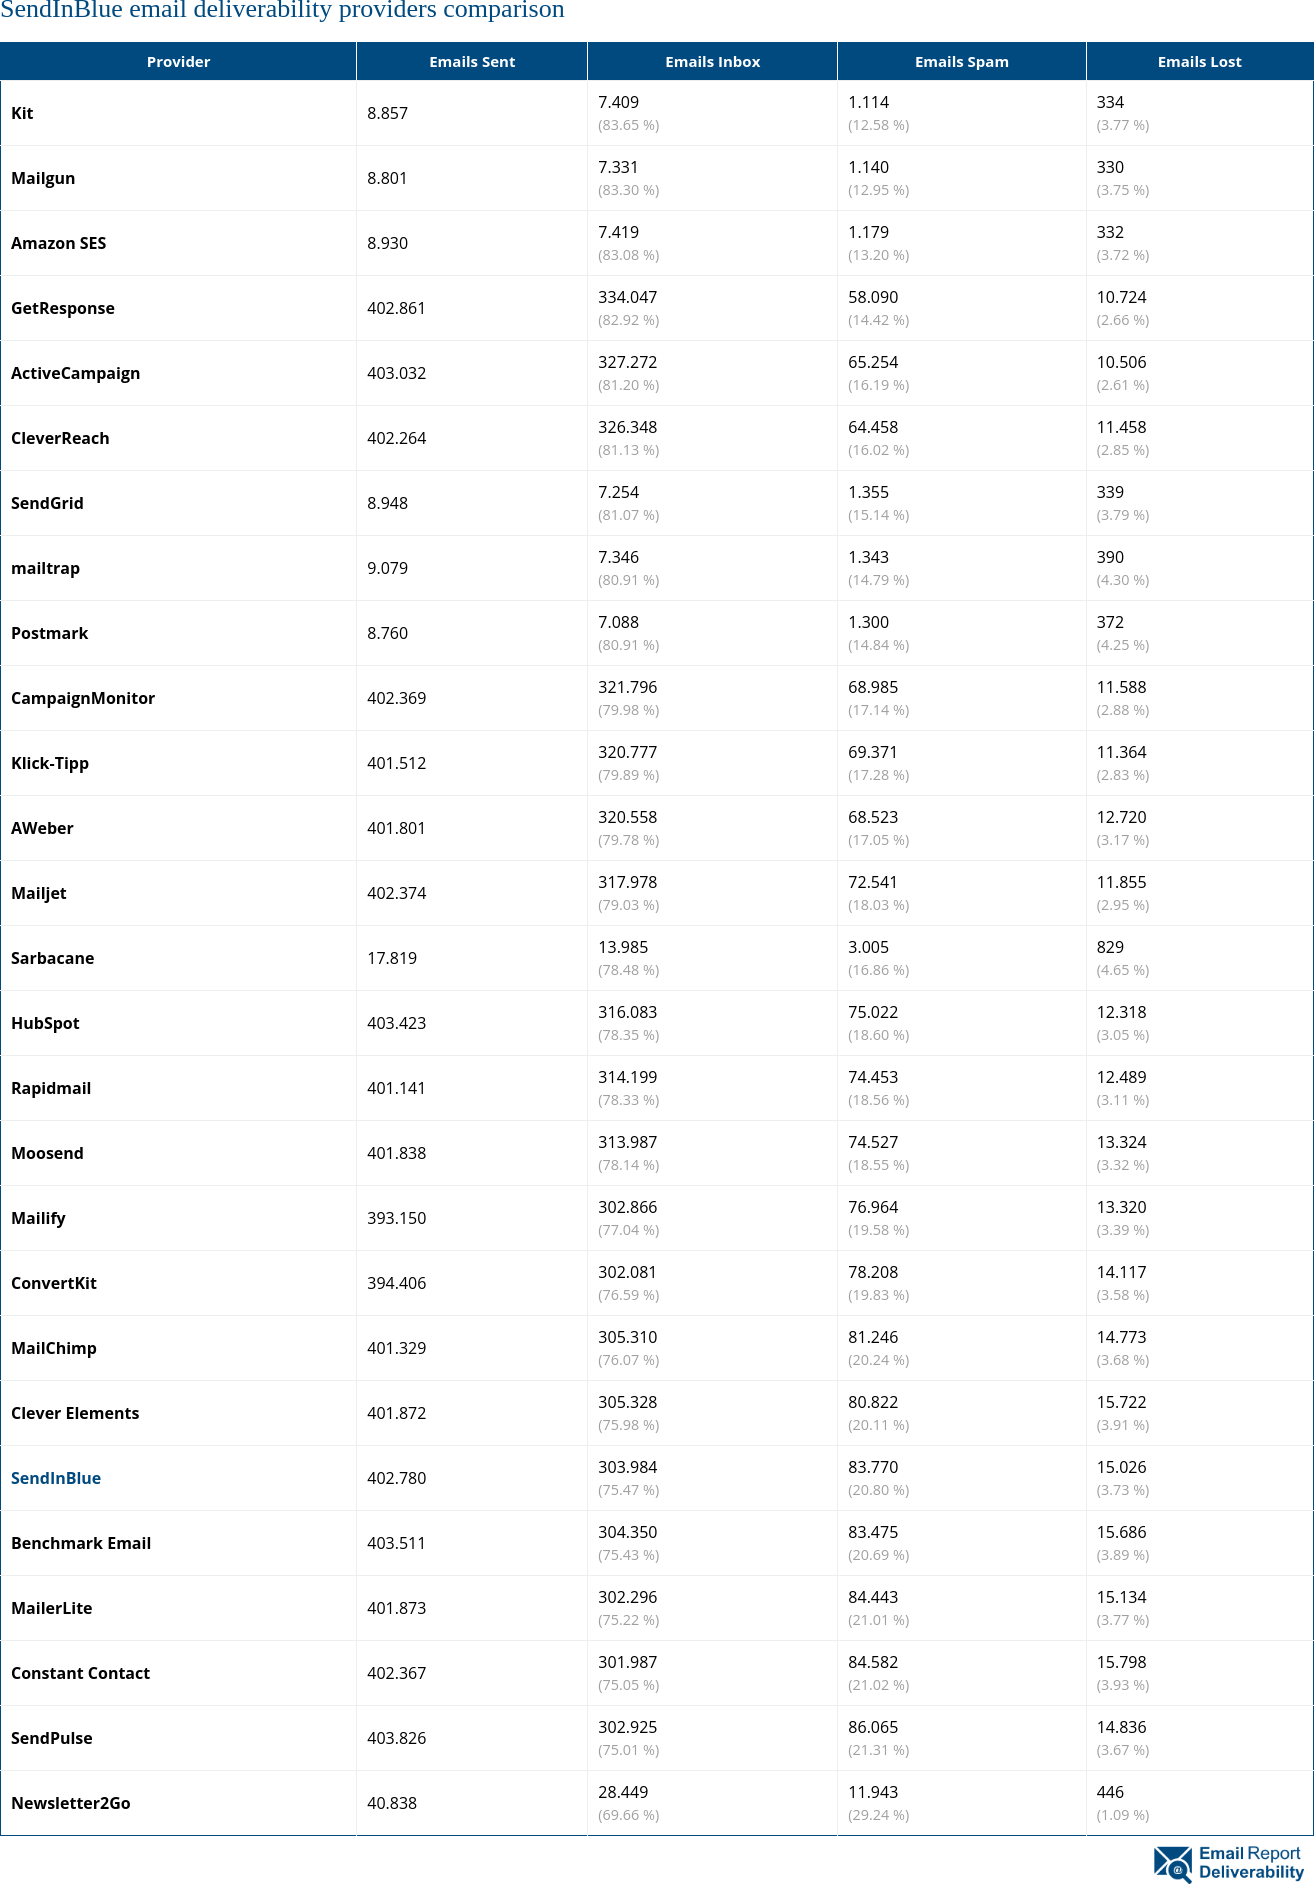
Image URL
Email deliverability rates for SendInBlue and other providers comparison
| Provider | Inbox (%) | Spam (%) | Lost (%) |
|---|---|---|---|
| GetResponse | 81.10 % (52.595) | 17.27 % (11.200) | 1.88 % (1.219) |
| AWeber | 79.86 % (51.689) | 18.47 % (11.957) | 1.94 % (1.254) |
| CleverReach | 79.69 % (51.485) | 18.55 % (11.987) | 1.98 % (1.282) |
| HubSpot | 79.67 % (51.721) | 18.81 % (12.211) | 1.90 % (1.231) |
| Benchmark Email | 79.32 % (51.727) | 18.85 % (12.292) | 2.09 % (1.362) |
| Brevo | 78.96 % (51.606) | 19.48 % (12.735) | 2.00 % (1.306) |
| mailtrap | 78.93 % (50.801) | 19.41 % (12.496) | 2.12 % (1.364) |
| Klick-Tipp | 78.60 % (51.104) | 19.55 % (12.712) | 2.20 % (1.428) |
| Postmark | 78.51 % (50.217) | 19.73 % (12.619) | 2.21 % (1.413) |
| MailChimp | 78.35 % (51.137) | 20.03 % (13.071) | 2.09 % (1.361) |
| MailerLite | 78.24 % (50.857) | 19.88 % (12.922) | 2.24 % (1.453) |
| CampaignMonitor | 78.21 % (50.429) | 20.07 % (12.942) | 2.05 % (1.320) |
| Sarbacane | 78.20 % (50.734) | 20.26 % (13.143) | 1.95 % (1.267) |
| Amazon SES | 78.15 % (50.995) | 19.74 % (12.880) | 2.32 % (1.512) |
| Mailjet | 78.05 % (50.113) | 20.04 % (12.867) | 2.21 % (1.421) |
| SendPulse | 77.97 % (50.459) | 20.26 % (13.109) | 2.26 % (1.463) |
| Kit | 77.77 % (50.481) | 20.38 % (13.230) | 2.19 % (1.420) |
| Constant Contact | 77.19 % (49.829) | 20.60 % (13.300) | 2.69 % (1.734) |
| Rapidmail | 77.03 % (49.316) | 20.86 % (13.356) | 2.45 % (1.567) |
| Clever Elements | 77.00 % (49.164) | 20.87 % (13.326) | 2.54 % (1.624) |
| Mailgun | 76.67 % (49.541) | 21.33 % (13.785) | 2.44 % (1.579) |
| ActiveCampaign | 76.59 % (49.739) | 21.25 % (13.801) | 2.56 % (1.663) |
| Moosend | 76.56 % (49.689) | 21.26 % (13.800) | 2.57 % (1.670) |
| SendGrid | 76.06 % (49.094) | 21.88 % (14.120) | 2.47 % (1.594) |
Preview
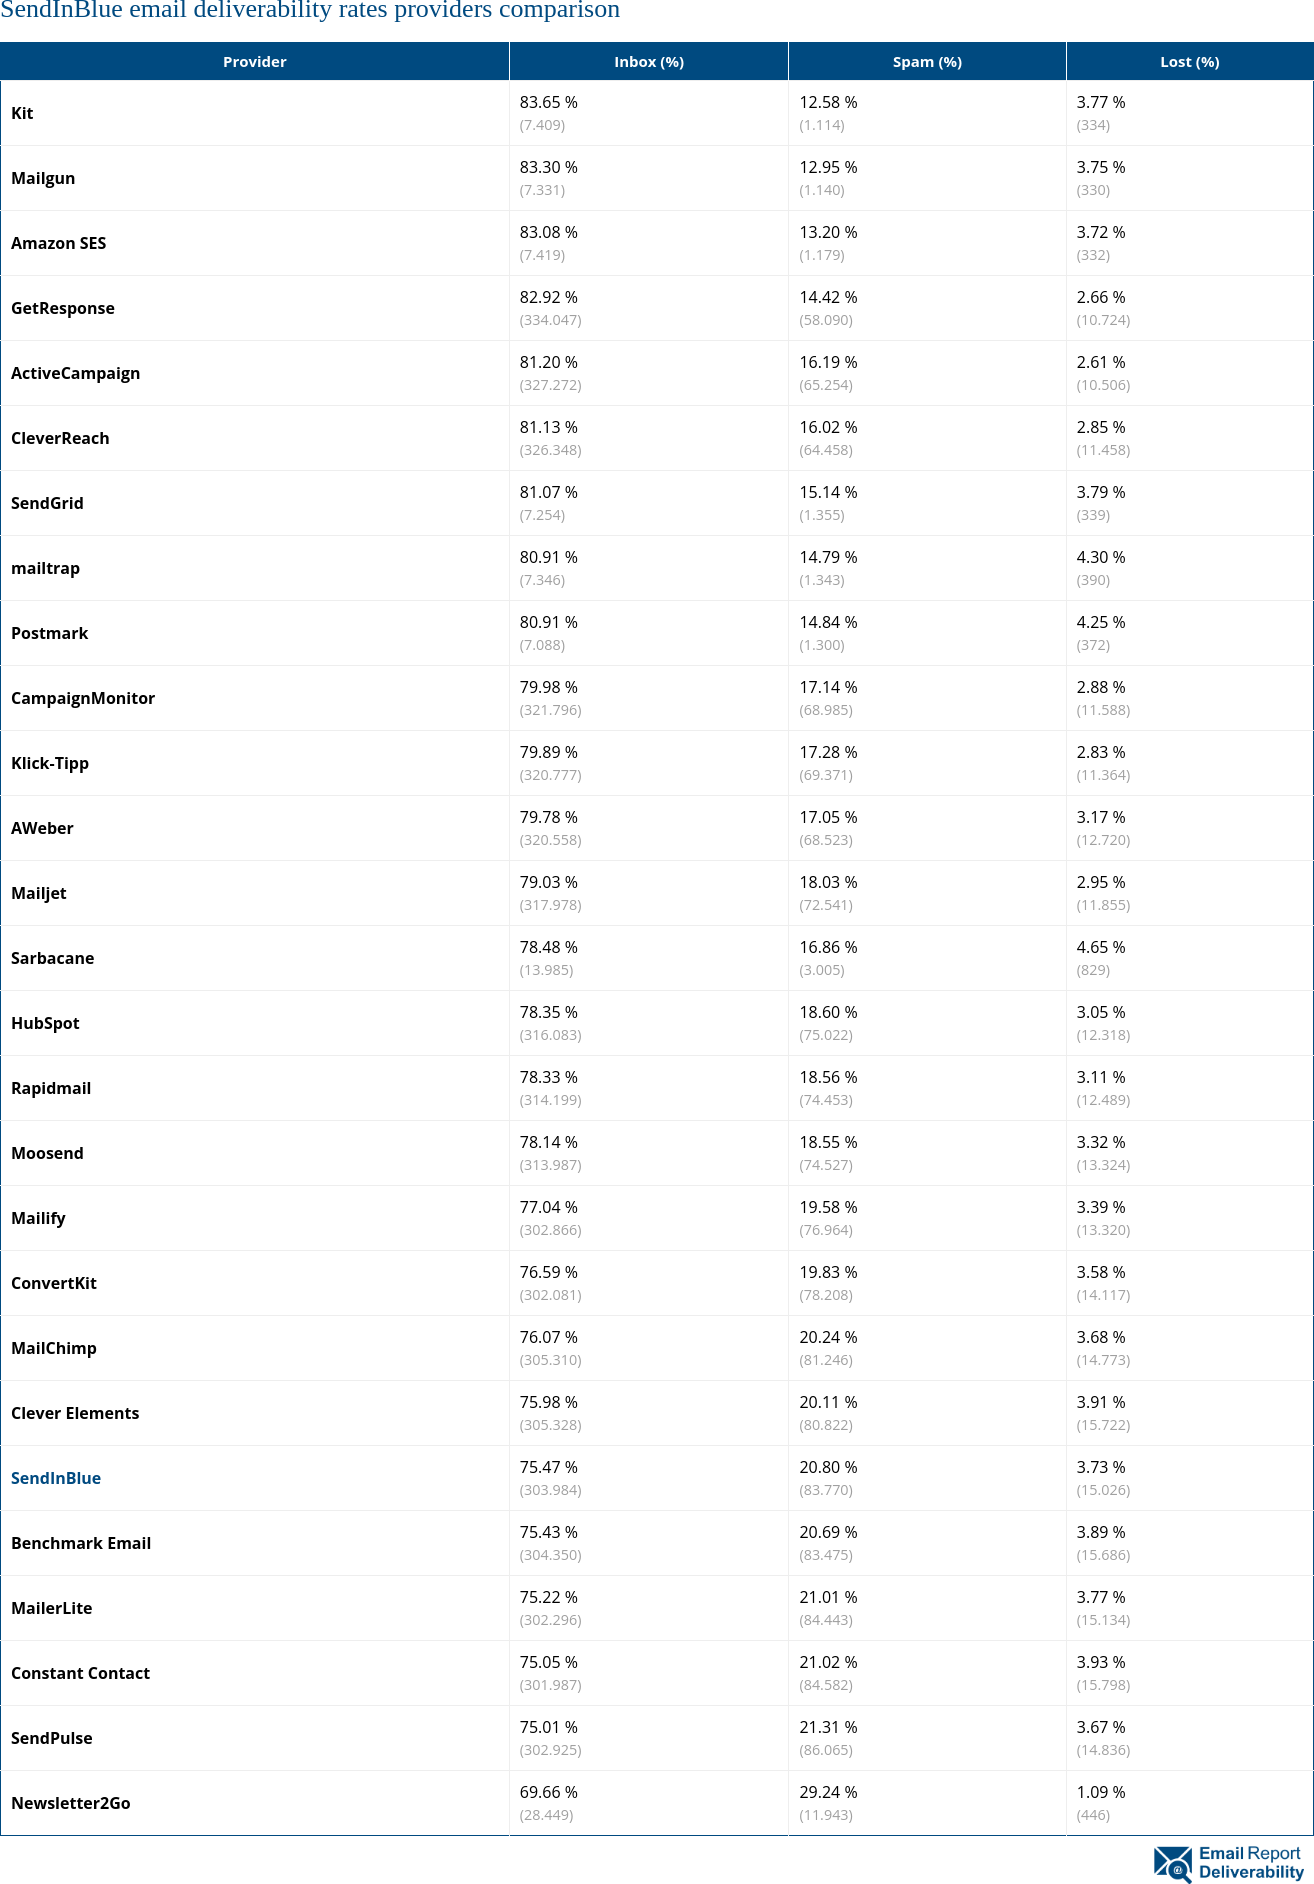
Image URL
Email deliverability by category
Not enough data to show a table.
Preview

Image URL
Email deliverability by email service provider
Not enough data to show a table.
Preview
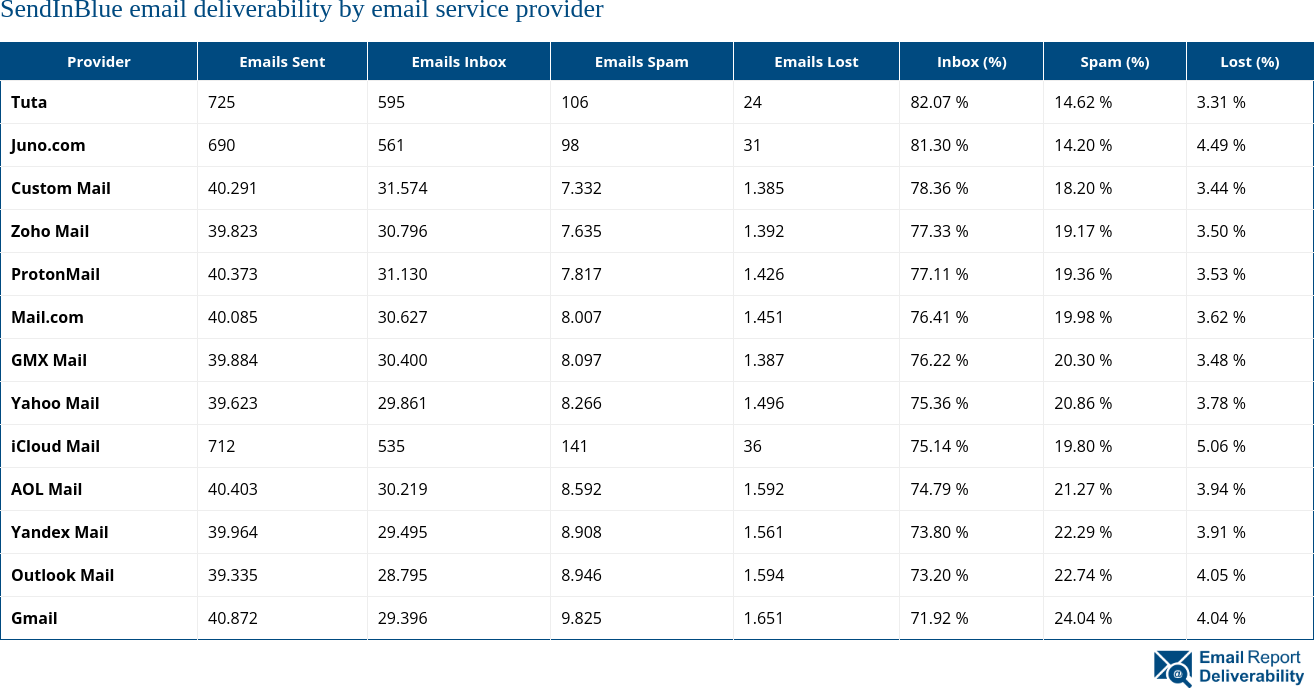
Image URL
SendInBlue badges for website
The following badges for SendInBlue can be embedded into a website.
SendInBlue
80
/100
SendInBlue
80
/100
SendInBlue
80
/100
References and Resources
Further resources and references for SendInBlue.
No references or resources found.