 Deutsch
 English
 Русский
SendInBlue Email Deliverability Report

Email deliverability for SendInBlue and other providers comparison
| Provider | Emails sent | Emails inbox | Emails spam | Emails lost |
|---|---|---|---|---|
| Brevo | 65.773 | 51.817 (78.78 %) | 12.742 (19.37 %) | 1.214 (1.85 %) |
| Sarbacane | 65.728 | 51.728 (78.70 %) | 12.814 (19.50 %) | 1.186 (1.80 %) |
| HubSpot | 65.918 | 51.754 (78.51 %) | 12.850 (19.49 %) | 1.314 (1.99 %) |
| GetResponse | 65.801 | 51.648 (78.49 %) | 12.884 (19.58 %) | 1.269 (1.93 %) |
| Benchmark Email | 66.291 | 51.770 (78.10 %) | 13.154 (19.84 %) | 1.367 (2.06 %) |
| CleverReach | 65.591 | 51.083 (77.88 %) | 13.168 (20.08 %) | 1.340 (2.04 %) |
| Klick-Tipp | 65.861 | 51.295 (77.88 %) | 13.067 (19.84 %) | 1.499 (2.28 %) |
| Postmark | 64.919 | 50.483 (77.76 %) | 13.108 (20.19 %) | 1.328 (2.05 %) |
| mailtrap | 64.767 | 50.335 (77.72 %) | 13.133 (20.28 %) | 1.299 (2.01 %) |
| MailerLite | 65.706 | 50.988 (77.60 %) | 13.286 (20.22 %) | 1.432 (2.18 %) |
| SendPulse | 65.508 | 50.749 (77.47 %) | 13.326 (20.34 %) | 1.433 (2.19 %) |
| CampaignMonitor | 65.221 | 50.522 (77.46 %) | 13.308 (20.40 %) | 1.391 (2.13 %) |
| Kit | 65.682 | 50.857 (77.43 %) | 13.425 (20.44 %) | 1.400 (2.13 %) |
| AWeber | 65.609 | 50.656 (77.21 %) | 13.537 (20.63 %) | 1.416 (2.16 %) |
| SendGrid | 65.185 | 50.153 (76.94 %) | 13.533 (20.76 %) | 1.499 (2.30 %) |
| MailChimp | 66.382 | 51.054 (76.91 %) | 13.829 (20.83 %) | 1.499 (2.26 %) |
| Rapidmail | 64.757 | 49.798 (76.90 %) | 13.476 (20.81 %) | 1.483 (2.29 %) |
| Mailjet | 65.664 | 50.495 (76.90 %) | 13.655 (20.80 %) | 1.514 (2.31 %) |
| Mailgun | 65.108 | 50.027 (76.84 %) | 13.594 (20.88 %) | 1.487 (2.28 %) |
| ActiveCampaign | 65.674 | 50.321 (76.62 %) | 13.784 (20.99 %) | 1.569 (2.39 %) |
| Constant Contact | 65.457 | 49.992 (76.37 %) | 13.772 (21.04 %) | 1.693 (2.59 %) |
| Moosend | 65.558 | 49.851 (76.04 %) | 14.124 (21.54 %) | 1.583 (2.41 %) |
| Clever Elements | 64.718 | 49.115 (75.89 %) | 13.894 (21.47 %) | 1.709 (2.64 %) |
| Amazon SES | 66.041 | 49.987 (75.69 %) | 14.393 (21.79 %) | 1.661 (2.52 %) |
Preview
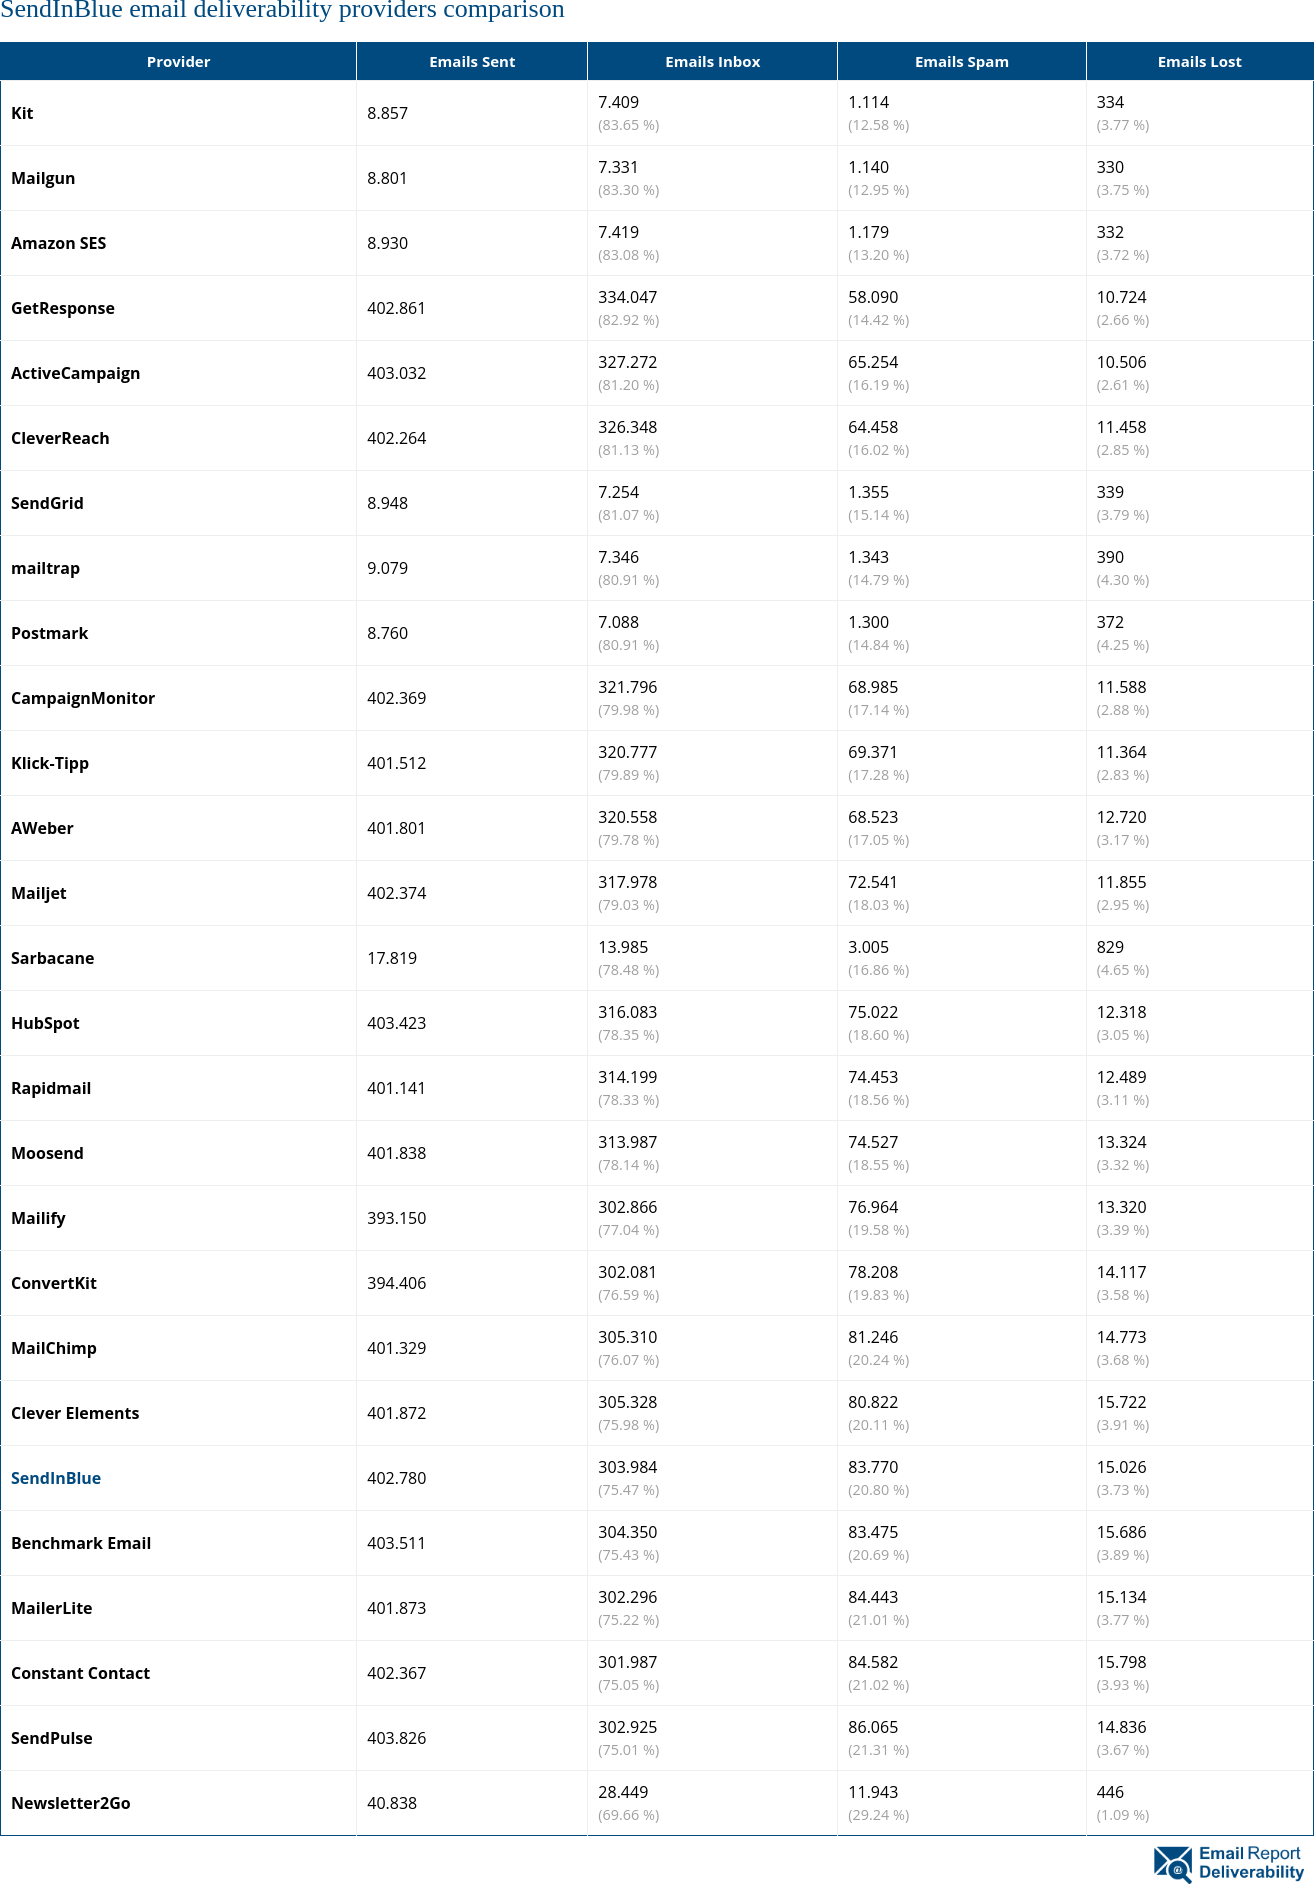
Image URL
Email deliverability rates for SendInBlue and other providers comparison
| Provider | Inbox (%) | Spam (%) | Lost (%) |
|---|---|---|---|
| Brevo | 78.78 % (51.817) | 19.37 % (12.742) | 1.85 % (1.214) |
| Sarbacane | 78.70 % (51.728) | 19.50 % (12.814) | 1.80 % (1.186) |
| HubSpot | 78.51 % (51.754) | 19.49 % (12.850) | 1.99 % (1.314) |
| GetResponse | 78.49 % (51.648) | 19.58 % (12.884) | 1.93 % (1.269) |
| Benchmark Email | 78.10 % (51.770) | 19.84 % (13.154) | 2.06 % (1.367) |
| CleverReach | 77.88 % (51.083) | 20.08 % (13.168) | 2.04 % (1.340) |
| Klick-Tipp | 77.88 % (51.295) | 19.84 % (13.067) | 2.28 % (1.499) |
| Postmark | 77.76 % (50.483) | 20.19 % (13.108) | 2.05 % (1.328) |
| mailtrap | 77.72 % (50.335) | 20.28 % (13.133) | 2.01 % (1.299) |
| MailerLite | 77.60 % (50.988) | 20.22 % (13.286) | 2.18 % (1.432) |
| SendPulse | 77.47 % (50.749) | 20.34 % (13.326) | 2.19 % (1.433) |
| CampaignMonitor | 77.46 % (50.522) | 20.40 % (13.308) | 2.13 % (1.391) |
| Kit | 77.43 % (50.857) | 20.44 % (13.425) | 2.13 % (1.400) |
| AWeber | 77.21 % (50.656) | 20.63 % (13.537) | 2.16 % (1.416) |
| SendGrid | 76.94 % (50.153) | 20.76 % (13.533) | 2.30 % (1.499) |
| MailChimp | 76.91 % (51.054) | 20.83 % (13.829) | 2.26 % (1.499) |
| Rapidmail | 76.90 % (49.798) | 20.81 % (13.476) | 2.29 % (1.483) |
| Mailjet | 76.90 % (50.495) | 20.80 % (13.655) | 2.31 % (1.514) |
| Mailgun | 76.84 % (50.027) | 20.88 % (13.594) | 2.28 % (1.487) |
| ActiveCampaign | 76.62 % (50.321) | 20.99 % (13.784) | 2.39 % (1.569) |
| Constant Contact | 76.37 % (49.992) | 21.04 % (13.772) | 2.59 % (1.693) |
| Moosend | 76.04 % (49.851) | 21.54 % (14.124) | 2.41 % (1.583) |
| Clever Elements | 75.89 % (49.115) | 21.47 % (13.894) | 2.64 % (1.709) |
| Amazon SES | 75.69 % (49.987) | 21.79 % (14.393) | 2.52 % (1.661) |
Preview
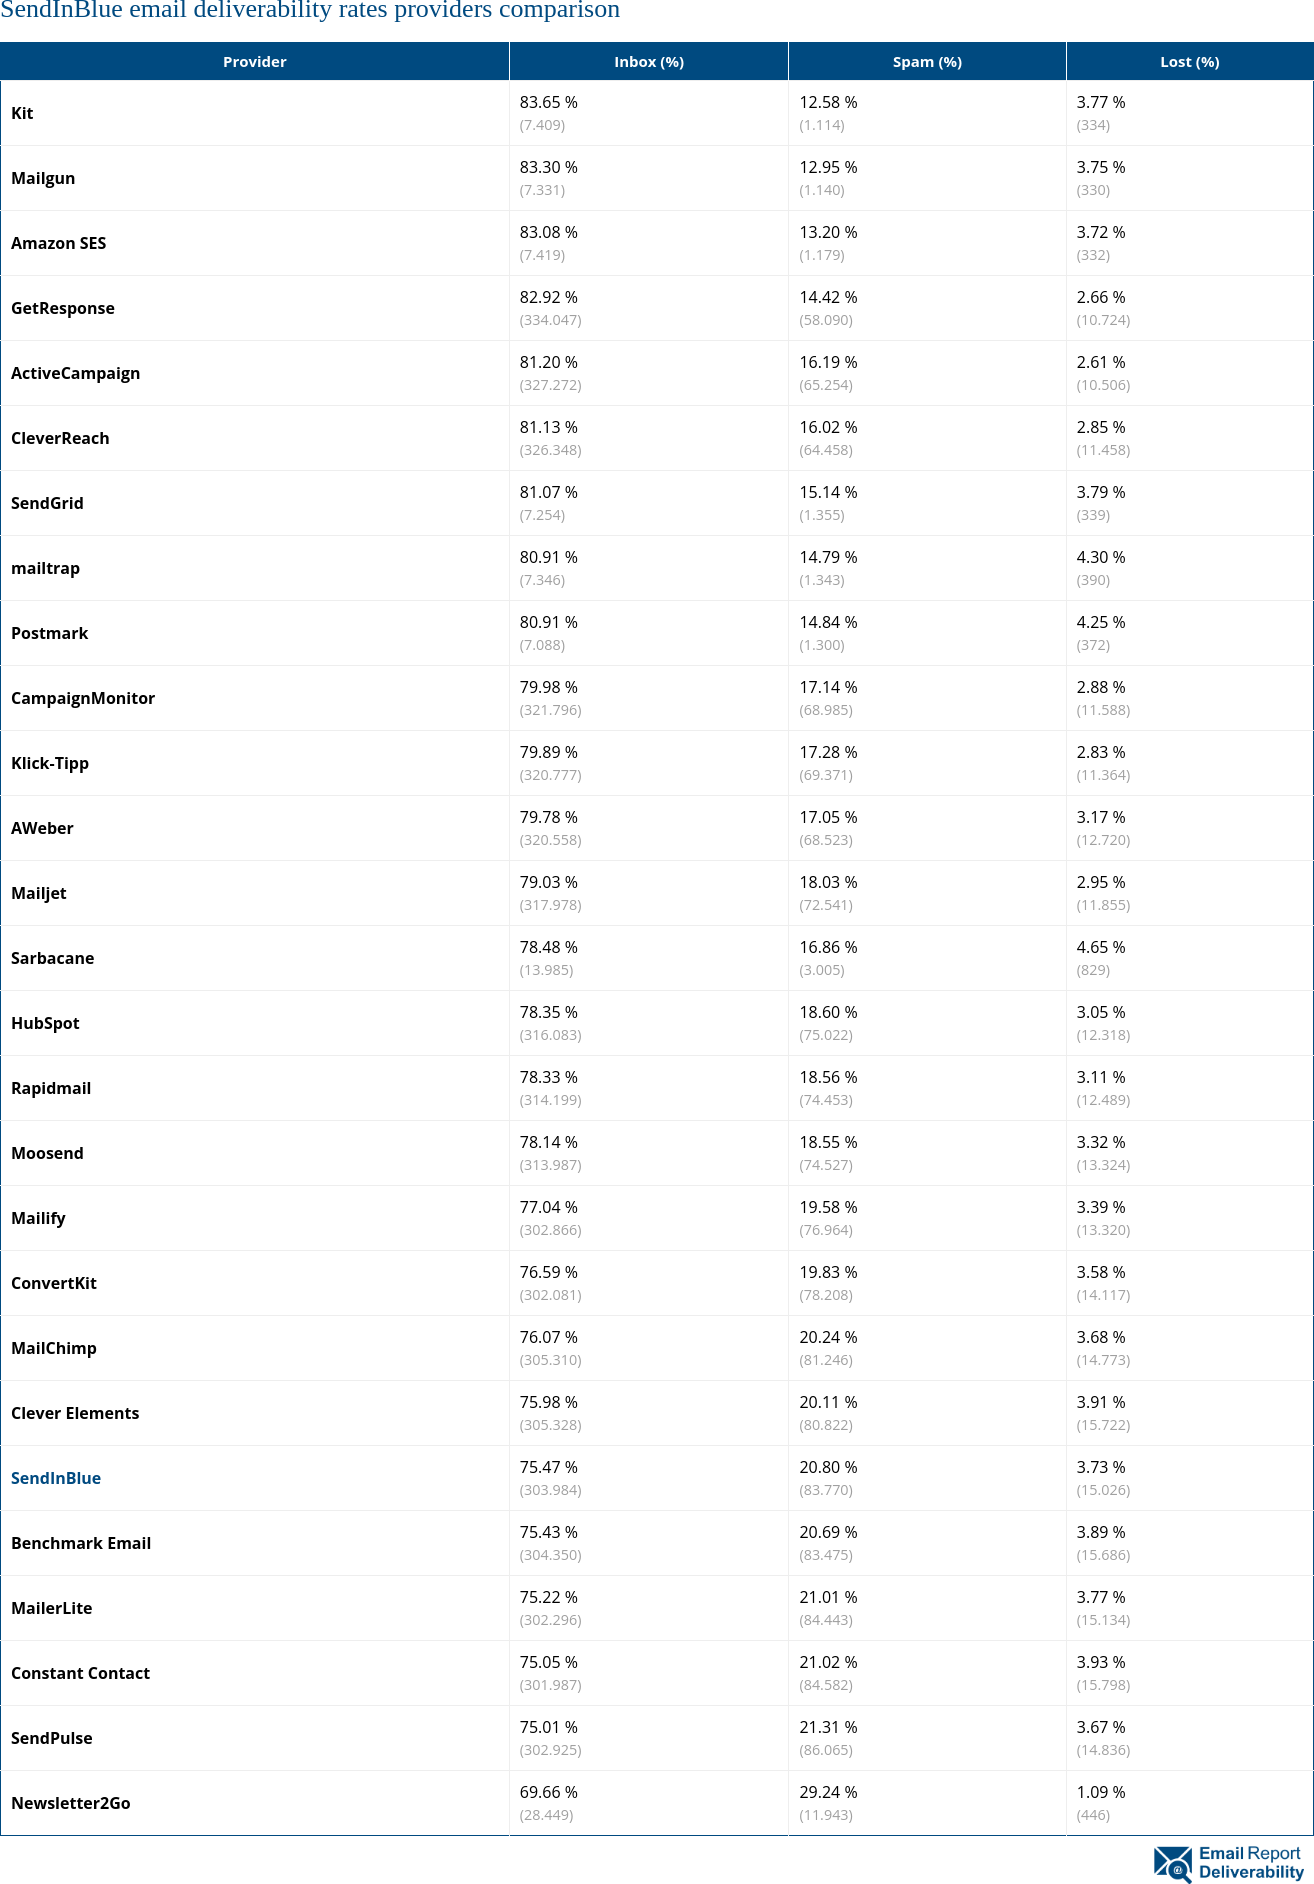
Image URL
Email deliverability by category
Not enough data to show a table.
Preview

Image URL
Email deliverability by email service provider
Not enough data to show a table.
Preview
Image URL
SendInBlue badges for website
The following badges for SendInBlue can be embedded into a website.
SendInBlue
80
/100
SendInBlue
80
/100
SendInBlue
80
/100
References and Resources
Further resources and references for SendInBlue.
No references or resources found.